Solar Wind Spectrometer
| |
|
Solar Wind Spectrometer |
Previous Next |
|
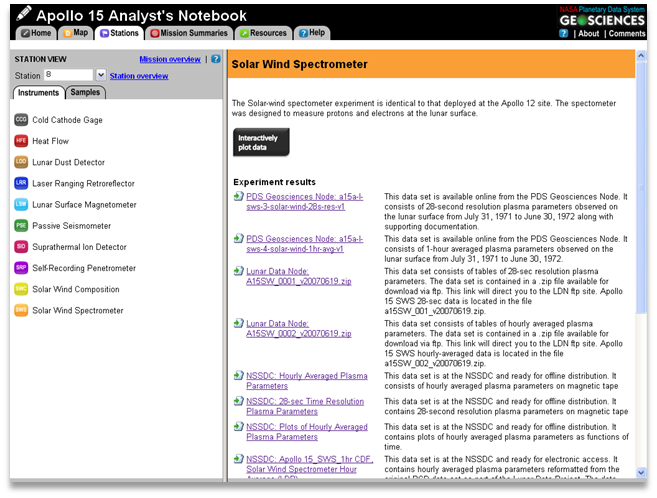
Solar Wind Spectrometer data from Apollo 12 and 15 are available from the PDS-geosciences node. The data set contains time-ordered plasma parameters at 28-second and hourly resolutions.
Each 28-second data table contains a sequence of plasma measurements made every 28.1 seconds. Each record in a table provides the time of a measurement, proton density, alpha-to-proton ratio, proton bulk speed, and angle of flow. Each record identifies the Faraday cup on the side of the instrument (one of six) that measured the most charge. The measured charge of this cup, the adjacent side cups, and the vertical (top) cup are included in each record as well as the most probable thermal speed, and various housekeeping and fit parameters relating to the reliability of the calculated plasma parameters. Note that a value of 99.0 in Column 14, the Percentage Error in Fitting Program, indicates the fit was bad and thus all computed plasma parameters in that row are invalid.
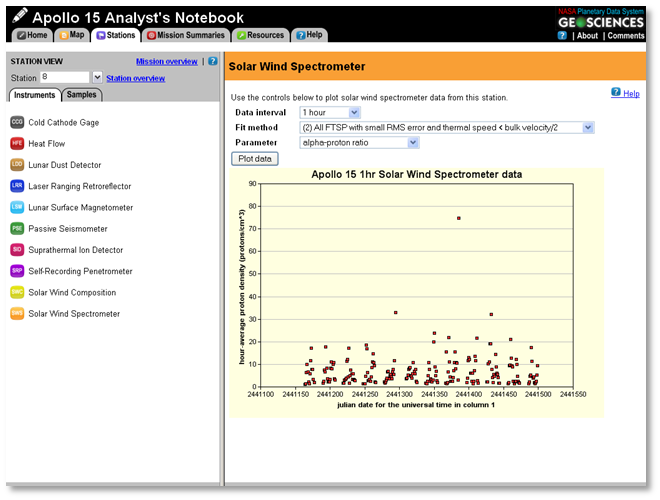
Each 1-hour data table contains hourly averaged parameters and provides four sets (referred to in the notebook as "fit method") of computed hourly parameters using as input data: (1) all fine-time scale parameters (FTSP), (2) all FTSP computed from spectra with small root-mean-square (RMS) error on curve fitting and thermal speeds less than one-half the bulk velocity, (3) all FTSP computed from spectra that satisfy the requirements of criterion 2 as well as having only one flow angle that can be directly measured, and (4) all FTSP computed from spectra that satisfy the requirements of criterion 2 as well as having both flow angles directly measurable. Contained in each of the four sets of averages are the proton density, alpha-to-proton ratio, bulk speed, angle of flow, number of spectra, and RMS deviations of each average.
These data tables are restorations of the original binary data recorded by the SWS experiment and were reviewed internally at the NSSDC for accuracy and completeness.
The apollo notebook contains links to this data set via the SWS instrument page under the "Stations" tab. The notebook also provides an interactive plotting tool to plot plasma parameters vs. time for both 28-second and hourly averaged data. The tool can be accessed via the "Interactively plot data" button on the SWS instrument page.
The tool allows you to choose the time interval and plasma parameter for plotting. Additionally, for the hourly-averaged data set, you can choose which fit method to use. Note that this tool is not meant for data analysis, it provides a preview of the data. For further analysis please download the complete data set archive using the links provided on the SWS instrument page.
|