Image viewer measurement tools
MERApplies to the
MER ANMSLApplies to the
MSL ANPHXApplies to the
PHX AN
The Image viewer includes tools for finding locations in an image, as well as making measurements and viewing elevation profiles on images with stereo data.
-
For single frame images (not mosaics), location, distance, and profile tools are available for images with associated XYZ data. Currently, only some MSL

 Hazcam and
  Navcam; MER
 Hazcam,
  Navcam, and
  Pancam; and Phoenix SSI images fall into this category.
 -
Mosaics from the MERApplies to the
MER AN MER Opportunity and Spirit rovers rover archive with stereo sources (most Navcam mosaics) support location and distance tools. However, note that most mosaics were generated from non-linearized images, and all XYZ data are linearized. We configured the measurement tools to use the linearized XYZ data for all MER mosaic measurements. From our perspective, the 99+% accuracy of this method is better than having no measurements at all. For single frame images, we pair the linearized XYZ data only with linearized source images. -
Mosaics from the MSLApplies to the
MSL AN MSL Curiosity rover archive with stereo sources (most Navcam mosaics) support location and distance tools.
Selecting a measurement tool
Measurement tools can be selected in three ways. Select a tool from the Measure menu in the controls toolbar, click on the tool icon in the toolbox above the image, or click the "Add new" button in the function panel to the left of the image (e.g., "Add new location" or "Add new distance". Instructions for using the tool appear above the image.
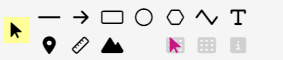
Image viewer toolbox
A toolbox is located above the image, providing a shortcut to drawing and measurement tools.
| Measurement Tool | Make a new measurement by selecting the measurement tool and then... |
|---|---|
| Location | Click the desired point on the image. |
| Distance | Click the starting point of the measurement. Left-click additional intermediate points along the path. Right-click the final point on the image or click the Complete button above the image to complete the measurement. |
| Profile | Click the starting point of the measurement. Left-click additional intermediate points along the path. Right-click the final point on the image or click the Complete button above the image to complete the measurement. |
Location tool
Use this tool to find location information for individual pixels in the image.
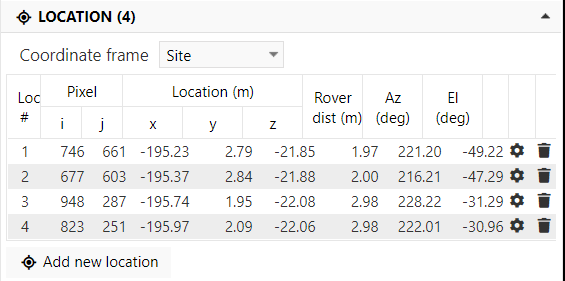
For each location, the location table shows:
- Location number - used to label the point on the image
- Image pixel coordinate in i,j space (lines, samples), with the origin at 0,0 in the upper left corner
- Ground location in x,y,z space in meters in local, rover, or site frame. Values are given in meters.
- The distance from the point to the rover, in meters.
- The azimuth and elevation, in degrees. For MER, these values are relative to the PMA head frame. For MSL, these values are relative to the RSM head frame.
You can set the style of a location by clicking on the settings icon in the Location list.
Delete a location measurement by clicking the corresponding delete icon in the location list.
Finding a location from known coordinates
You can find a location on the image based on known coordinate values. In the Image viewer menu, click on Measure > Find location and enter either (x, y) or (x, y, z) values in Site, Rover, or Local frame. Using the archive XYZ image data, the nearest position, if present, will be added to the location list.
Distance tool
Use this tool to find distance information between two locations. A distance measurement is made of one or more contiguous segments (a polyline) that is defined by left-clicking on vertices of a polyline. After selecting at least two points, right click the mouse or click the Complete button above the image to complete the polyline.
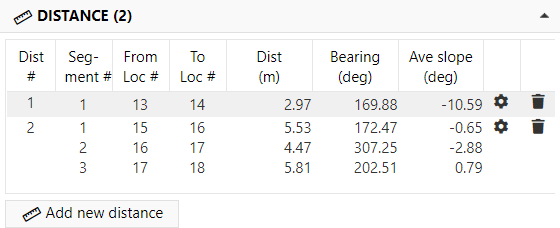
For each distance, the table shows:
- Distance number - used to group one or more segments that comprise the measurement
- Segment number - individual segment within a polyline
- From/to location numbers - reference to the labeled locations along the polyline; numbers match entries in the location table
- Distance between locations, in meters
- Compass bearing from the first to second location in the segment in site frame, in degrees
- Average slope from the first to second location in the segment, in degrees
By default, the distance between locations is displayed on the line. You can set the styles of distance measurements by clicking on the settings button () in the Distance list. Note that styles for the vertices are set in Locations settings.
Delete a distance measurement by clicking the corresponding delete icon () in the Distance list.
Profile tool
Use this tool to find the elevation profile between two locations on a single frame image. (Profiles are unavailable for mosaics.) A profile measurement is made of one or more contiguous segments (a polyline) that is defined by left-clicking on vertices of a polyline. After selecting at least two points, right click the mouse or click on the Complete button above the image to complete the polyline. Measurements listed are the same as described for the Distance tool above.

A graph showing all segments of the profile is displayed after it is defined. Click on the graph icon () at the right side of the profile table to the graph for a different profile.
The profile calculated returns the elevations along a path as if it were "dropped on the ground" between the two points. The profile is not simply the elevation values of the image pixels under the line drawn on the image.
By default, the distance between locations is displayed on the line drawn on the image between the vertices. You can set the styles of the profile by clicking on the settings icon () in the profile list. Note that styles for the vertices are set in Locations settings.
Delete a profile by clicking the corresponding delete icon () in the Profile list.
XYZ mask overlay
When viewing a single frame image with XYZ data, an XYZ mask is overlaid on the image when a measurement tool is selected. The purple shaded portions of the mask represent areas without XYZ data. The mask can be toggled off and on from the Measure menu.
The archived XYZ data products are used as sources for measurements.
Saving measurements
Measurements are automatically saved when you create them. As long as you log in with the same account, your measurements will automatically be loaded the next time you open the Image viewer for the same image.
Downloading the results
Download the measurement data and annotated image from the File menu. See Downloading the results in the Image viewer topic.
Styles
Locations, distances, and profiles are drawn on the image as annotations that can be styled using the Settings button under each table in the controls area. In addition, styles for an individual measurement can be changed by clicking on the corresponding settings icon ( ) in the measurement list.