Table view
INS M20
Some PDS4 data products are structured as a set of one or more tables containing ASCII or binary values as described by a detailed schema in the product label. The Analyst’s Notebook provides an interactive table viewer that lets you explore some of these products efficiently, even when they contain multiple tables, nested groups, or large numbers of fields. (The Table primer deep dive details PDS4 table structures.) The AN denotes a product as having tabular data using these icons:
| Table type | Data representation | |
|
|
Binary | Data are in binary format, software required to access values |
|
|
Character | Human and machine readable format; values are in fixed columns |
|
|
Delimited | Human and machine readable format; values are separated by a comma or another delimiter |
When available, the data product detail page displays the structure of the product and a preview of the data with the first rows of the table.
Table structure view
PDS4 products with data in table form follow strict standards regarding a record's fields can be defined. The Table structure view shows the fields and groups of fields that comprise each table's record structure with details such as a field's name, data type, units, and descriptions. This information helps you verify the table’s structure and provenance before viewing the data. The structure shown is read from the product's label file.
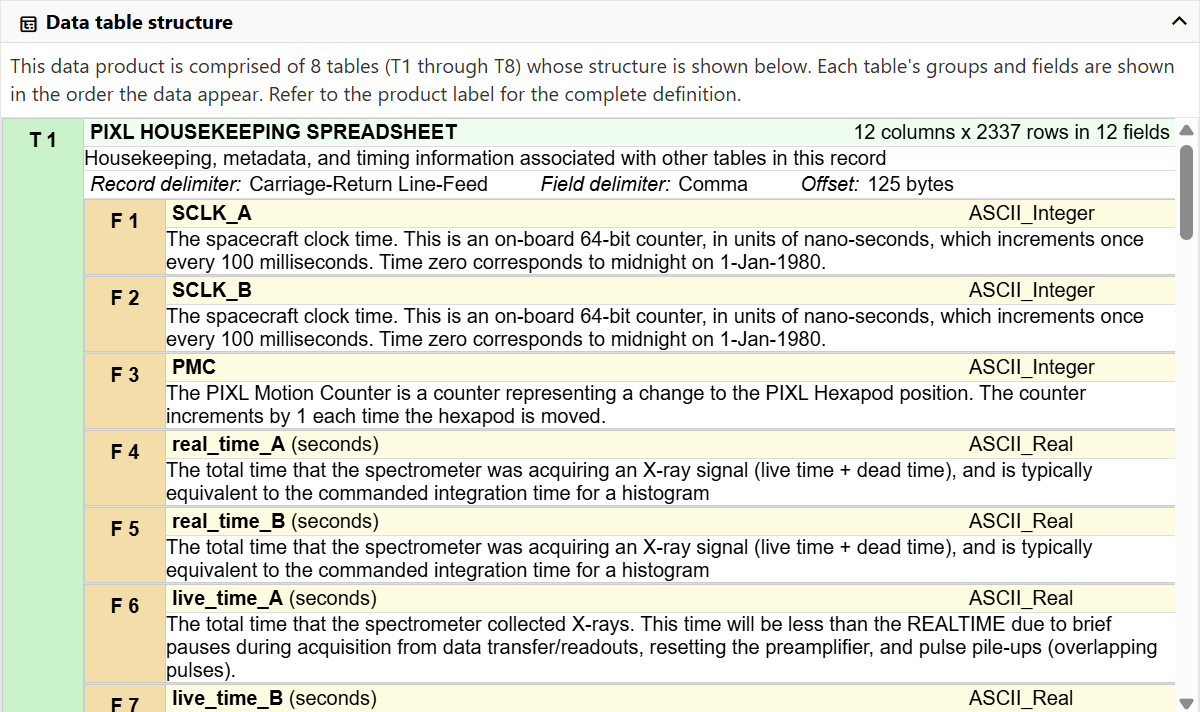
Table data view
Data tables often take the form of two dimension spreadsheets with rows and columns, but others are more complex and may contain repeating groups of data structures in each row. The Notebook's data view presents a flattened version of the table for previewing to help visualize the content.
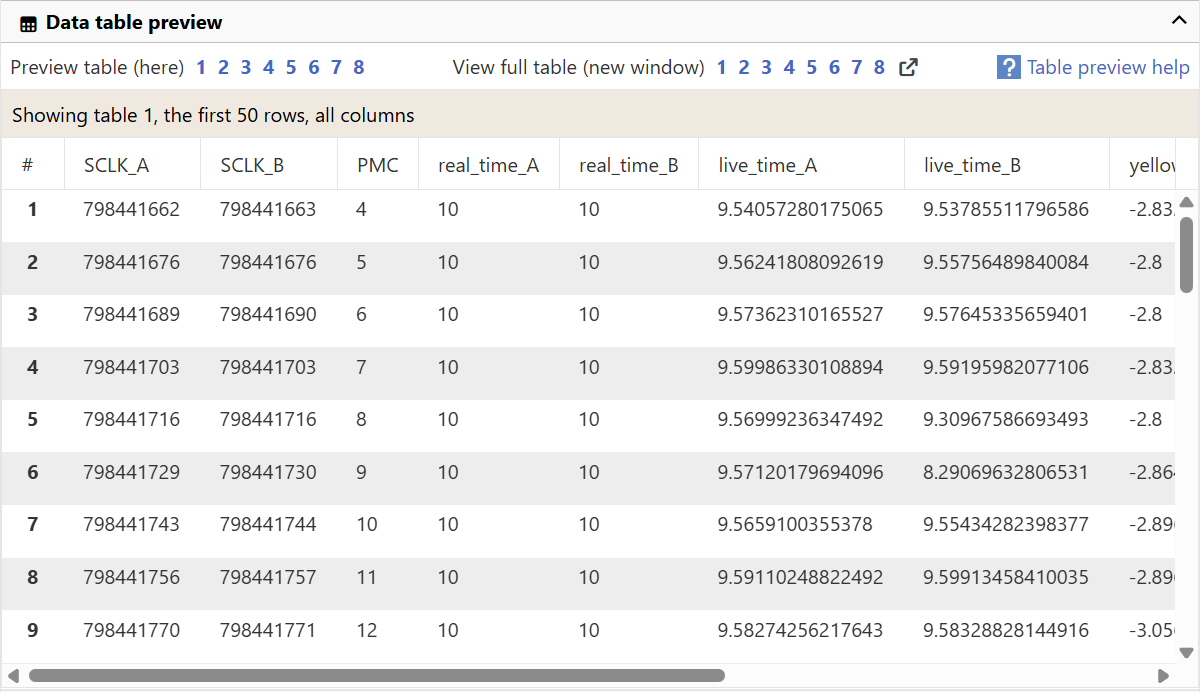
How many rows and columns?
A table data preview grid on the product's detail page (like the example in the image above) will include up to the first 50 rows of a table. From there, you can choose to view the full table which will allow you to page through the entire table. However, you may not see all table columns in either view.
Currently, we show only the first 10 repeated fields and groups in order to keep things manageable in your browser. For example, one table containing a histogram has 4096 repetitions of a single column, but we show only the first 10 rather than all 4096 for each table row.
When a field definition includes a scaling factor and value offset, they have been applied before displaying the value you see in the AN.
see also
- Product views
- Data detail page
- Table primer deep dive