Timeline
| |
|
Timeline |
Previous Next |
|
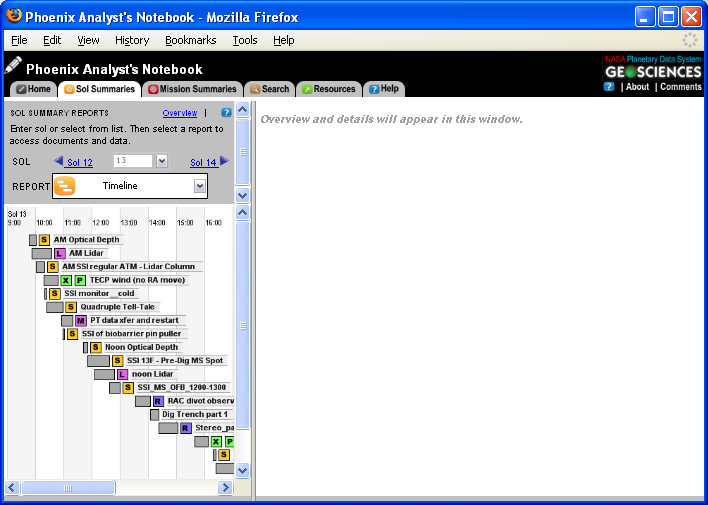
Timelines provide a schematic view of the activities for a given sol. The timelines are derived from the PSI tokened sequence plans.
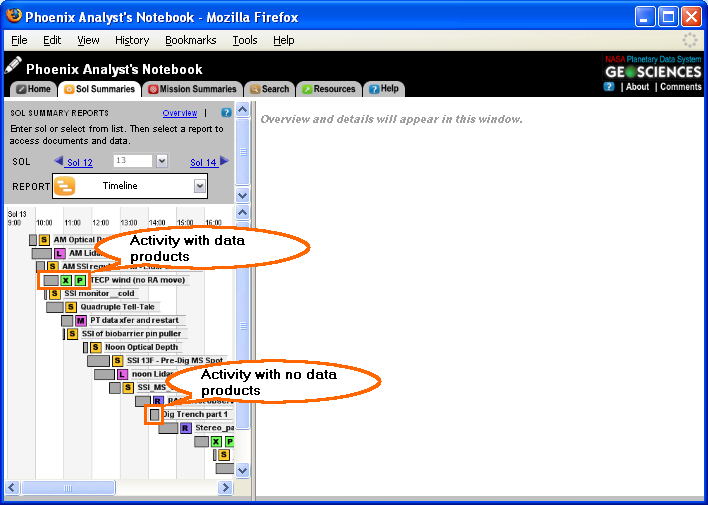
Planned activities are denoted by a gray box. Activities with associated notebook products are denoted by a colored experiment icon
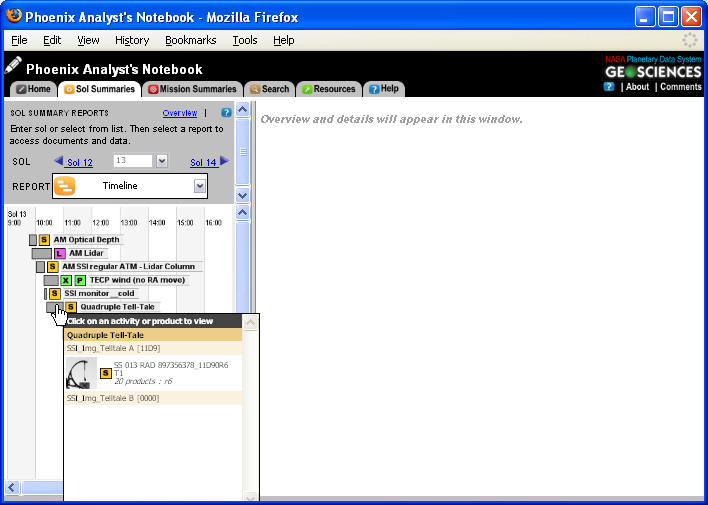
To view the details of a particular timeline event, hover over an observation segment to display a "flyout" detailing the observation. Click on an observation, activity, or data product to view the details.
Navigating to Timeline View
The timeline menu can be reached at any time by clicking on the "Sol Summaries" tab, selecting the desired sol, and selecting "Timeline" from the "Report" menu on the left side of the screen. |